The Official Portal Of Malaysia External Trade Development Corporation
Double-Digit Growth in Exports Pushes Malaysia's Trade to Record Level for February
Exports Continued to Record Consistent Growth Since July 2025, Supported by Significant Increases in E&E Exports
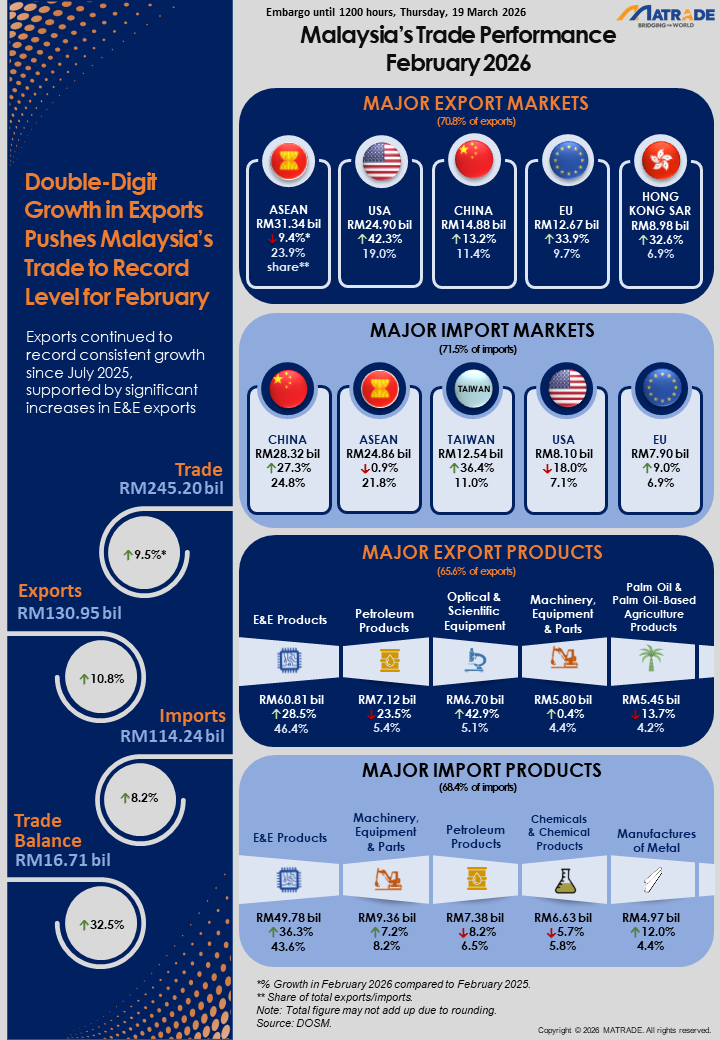
Malaysia’s trade remained on a firm growth trajectory in February 2026, rising 9.5% year-on-year (y-o-y) to RM245.20 billion and marking the sixth consecutive month of expansion. The growth was supported by consistent expansion in exports since July 2025 that grew by 10.8% to RM130.95 billion, while imports rose 8.2% to RM114.24 billion. This resulted in a trade surplus of RM16.71 billion, the 70th consecutive month of surplus since May 2020. Trade, exports and imports reached their highest monthly levels on record for the month of February.
The rise in exports was primarily supported by higher demand for manufactured goods notably electrical and electronic (E&E) products as well as optical and scientific equipment, and mining goods primarily metalliferous ores and metal scrap.
In terms of markets, exports to major trading partners namely the People’s Republic of China (China), the United States (US), Taiwan and the European Union (EU) posted double-digit expansion. Despite lower overall exports to Free Trade Agreement (FTA) partners, growth was recorded for Hong Kong SAR, Mexico, the Republic of Korea (ROK), India and the United Kingdom (UK).
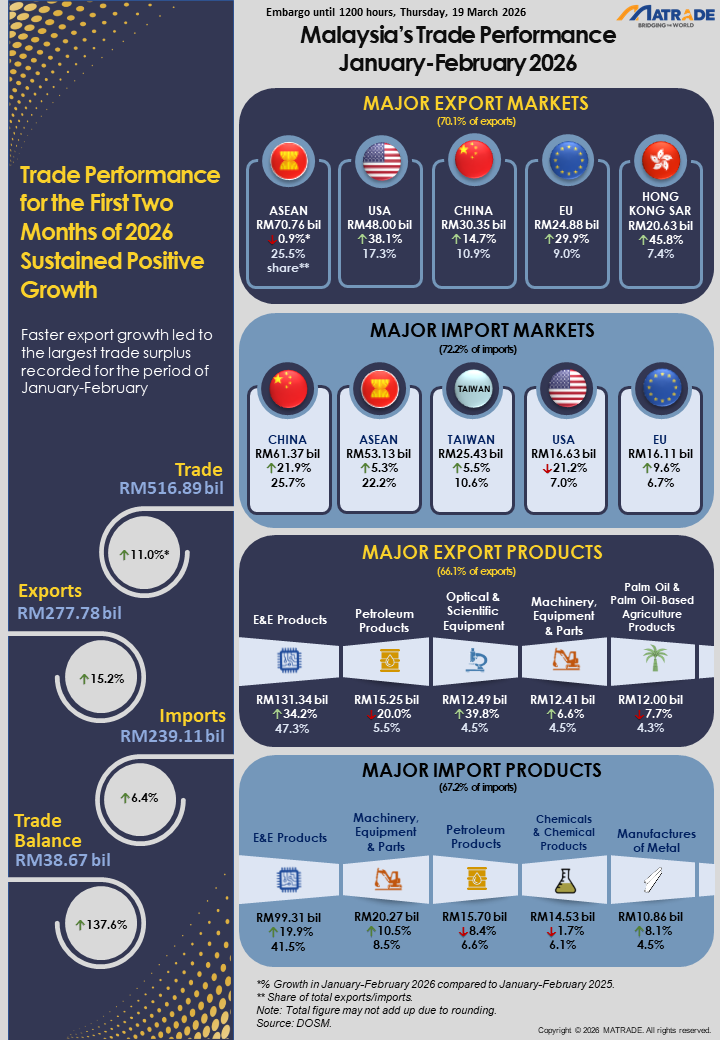
The country’s trade performance continued to strengthen in the first two months of 2026, rising 11.0% to RM516.89 billion compared to the corresponding period in 2025. Exports expanded by 15.2% to RM277.78 billion, while imports climbed 6.4% to RM239.11 billion, resulting in a trade surplus of RM38.67 billion. Trade, exports, imports and trade surplus also recorded their highest levels on record for the period.
Heightened geopolitical tensions in West Asia, particularly the escalating conflict between the US and Iran, has created additional uncertainties to global economic and trade outlook resulting in disruptions in international trade flows, particularly across Asia and Europe. Nevertheless, Malaysia’s trade performance in February 2026 remained resilient, supported by sustained demand for key export products, particularly E&E products, as well as diversified export markets.
Looking ahead, continued vigilance remains essential, as prolonged geopolitical instability could weigh on global demand and supply chain dynamics, potentially affecting Malaysia’s trade performance. As trade activities persist, MITI and MATRADE will continue to closely monitor global developments to navigate potential disruptions and mitigate their impact in the months ahead. Malaysian exporters are encouraged to grasp the benefits of existing FTAs, tap into emerging markets and broaden their product portfolios to stay resilient amid the uncertainties.
Export Performance of Major Sectors
E&E Products Continued to Anchor Export Growth
In February 2026, exports of manufactured goods which made up 87.2% of total exports maintained its double-digit growth for the third month in a row, rising 12.8% y-o-y to RM114.21 billion. The expansion was led by strong demand for E&E products, optical and scientific equipment as well as machinery, equipment and parts.
Exports of mining goods (6.2% share) in February 2026 sustained its growth trajectory, registering double-digit expansion of 12.3% y-o-y to RM8.12 billion owing to greater exports of metalliferous ores and metal scrap which posted the highest value ever, as well as, crude petroleum which due to increased export volumes despite lower export prices.
Exports of agriculture goods (5.5% share) in February 2026 shrank 16.4% y-o-y to RM7.23 billion, due to lower export prices of palm oil and palm oil-based agriculture products despite higher export volumes.
Major exports in February 2026:
• E&E products, valued at RM60.81 billion and accounted for 46.4% of total exports, increased by 28.5% compared to February 2025;
• Petroleum products, RM7.12 billion, 5.4% of total exports, ↓23.5%; • Optical and scientific equipment, RM6.70 billion, 5.1% of total exports, ↑42.9%; • Machinery, equipment and parts, RM5.80 billion, 4.4% of total exports, ↑0.4%; and • Palm oil and palm oil-based agriculture products, RM5.45 billion, 4.2% of total exports, ↓13.7%.
On a month-on-month (m-o-m) basis, exports of manufactured, mining and agriculture goods declined by 10.3%, 7.3% and 18.7% respectively.
For the period of January to February 2026, exports of manufactured goods recorded double-digit expansion of 17.6% to RM241.56 billion compared to the same period in the previous year, supported by robust demand for E&E products, optical and scientific equipment as well as machinery, equipment and parts. Exports of mining goods grew by 7.1% to RM16.88 billion, backed by higher exports of metalliferous ores and metal scrap. On the other hand, exports of agriculture goods shrank 9.3% to RM16.12 billion following decrease in exports of palm oil and palm oil-based agriculture products as well as natural rubber.
Trade Performance with Major Markets
In February 2026, Malaysia’s trade with major trading partners namely ASEAN, China, the US, Taiwan and the EU accounted for 70.9% share of Malaysia’s total trade.
ASEAN – Exports of E&E Products Expanded Amid Slower Trade
In February 2026, trade with ASEAN which took up 22.9% of Malaysia’s total trade declined by 5.8% y-o-y to RM56.20 billion. Exports to ASEAN fell 9.4% to RM31.34 billion as a result of lower exports of petroleum products, chemicals and chemical products as well as machinery, equipment and parts. Nevertheless, the contraction was cushioned by greater exports of optical and scientific equipment, E&E products as well as crude petroleum. Imports from ASEAN reduced by 0.9% to RM24.86 billion.
Breakdown of exports to ASEAN countries:
- Singapore RM15.21 billion, decreased by 17.1%, y-o-y;
- Thailand RM5.52 billion, ↑17.8%;
- Viet Nam RM4.49 billion, ↑11.7%;
- Indonesia RM2.91 billion, ↓36.0%;
- Philippines RM1.97 billion, ↑9.1%;
- Cambodia RM490.2 million, ↑30.2%;
- Myanmar RM419.1 million, ↑22.4%;
- Brunei RM321.1 million, ↓27.4%;
- Lao PDR RM3.3 million, ↓70.7%; and
- Timor-Leste RM2.5 million, ↑29.7%.
Exports to major markets in ASEAN that recorded increases were to Thailand, which expanded by RM834.2 million y-o-y and the Philippines, which rose RM163.4 million, supported by higher exports of E&E products. Meanwhile, exports to Viet Nam rose RM471.5 million, buoyed by higher exports of petroleum products.
Compared to January 2026, trade, exports and imports were lower by 17.0%, 20.5% and 12.1% respectively.
For the period of January to February 2026, trade with ASEAN grew by 1.7% to RM123.88 billion compared to the same period in 2025. Exports edged down by 0.9% to RM70.76 billion on lower exports of petroleum products. Amid the contraction, growing exports were seen for E&E products. Imports from ASEAN were up by 5.3% to RM53.13 billion.
China – Double-Digit Growth for Trade, Exports and Imports
In February 2026, trade with China which contributed 17.6% to Malaysia’s total trade surged by 22.1% y-o-y to RM43.19 billion. Exports to China recorded double-digit growth of 13.2% to RM14.88 billion as a result of higher exports of metalliferous ores and metal scrap as well as E&E products. Imports from China grew by 27.3% to RM28.32 billion.
Compared to January 2026, trade, exports and imports slipped by 11.0%, 3.8% and 14.3%, respectively.
Trade with China in the first two months of 2026 climbed 19.4% to RM91.72 billion compared to the same period in 2025. Exports strengthened by 14.7% to RM30.35 billion on the back of robust exports of metalliferous ores and metal scrap as well as E&E products. Imports from China grew by 21.9% to RM61.37 billion.
The US – Robust Trade Attributed to Higher Exports
In February 2026, exports to the US soared by 42.3% to RM24.90 billion, leading to increased trade with the country which rose 20.5% y-o-y to RM33.00 billion, representing 13.5% of Malaysia’s total trade. The export expansion was recorded for the third consecutive month, driven mainly by robust demand for E&E products. Imports from the US contracted by 18.0% to RM8.10 billion.
On a m-o-m basis, trade and exports grew by 4.3% and 7.8%, respectively while imports declined by 4.9%.
During the first two months of 2026, trade with the US expanded by 15.7% to RM64.63 billion compared to the same period in 2025. Exports increased by 38.1% to RM48.00 billion as a result of strong exports of E&E products. Imports from the US decreased by 21.2% to RM16.63 billion.
Taiwan – Resilient Trade Recorded
In February 2026, trade with Taiwan which comprised 8.5% of Malaysia’s total trade soared by 46.9% y-o-y to RM20.91 billion. Exports surged by 65.9% to RM8.37 billion, attributed to higher demand for E&E products, optical and scientific equipment as well as machinery, equipment and parts. Imports from Taiwan grew by 36.4% to RM12.54 billion.
On a m-o-m basis, trade, exports and imports waned by 8.3%, 15.7% and 2.7%, respectively.
For the period of January to February 2026, trade with Taiwan increased by 26.1% to RM43.73 billion compared to the same period in 2025. Exports soared by 73.0% to RM18.30 billion, due to strong exports of E&E products as well as optical and scientific equipment. Imports from Taiwan climbed 5.5% to RM25.43 billion.
The EU – Double-Digit Growth for Trade and Exports
In February 2026, trade with the EU which absorbed 8.4% of Malaysia’s total trade rose 23.1% y-o-y to RM20.57 billion. Exports registered double-digit expansion for the 6th successive month, rising 33.9% to RM12.67 billion, spurred by larger exports of E&E products as well as metalliferous ores and metal scrap. Imports from the EU expanded by 9.0% to RM7.90 billion.
Within the EU, the top 10 markets which accounted for 92.2% of Malaysia’s total exports to the region were:
- Netherlands RM4.52 billion, increased by 81.1%, y-o-y; • Germany RM3.60 billion, ↑14.5%;
- France RM787.3 million, ↑78.8%;
- Belgium RM587.3 million, ↓14.4%;
- Italy RM519.6 million, ↑8.7%;
- Sweden RM366.5 million, ↑136.1%;
- Ireland RM345.2 million, ↑163.4%;
- Czech Republic RM344.8 million, ↓7.0%;
- Spain RM317.3 million, ↓41.4%; and
- Poland RM290.7 million, ↑26.8%.
Exports to the Netherlands rose RM2.02 billion and exports to France expanded by RM347.0 million, following higher exports of E&E products. Meanwhile, exports to Germany which reached the highest value thus far, grew by RM455.8 million on higher exports of metalliferous ores and metal scrap.
Compared to January 2026, trade and exports edged up by 0.8% and 3.8% respectively, while imports contracted by 3.7%.
For the period of January to February 2026, trade with the EU climbed 21.1% to RM40.99 billion compared to the corresponding period in 2025. Exports strengthened by 29.9% to RM24.88 billion on higher exports of E&E products as well as metalliferous ores and metal scrap. Imports from the EU rose 9.6% to RM16.11 billion.
Trade with FTA Partners
In February 2026, trade with FTA partners which made up 63.3% of Malaysia’s total trade expanded by 6.0% y-o-y to RM155.31 billion. Exports to FTA partners contracted marginally by 0.7% to RM78.79 billion and imports grew by 13.9% to RM76.52 billion.
Despite lower overall exports to FTA partners, increases in exports were recorded to Hong Kong SAR, which rose 32.6% to RM8.98 billion as well as Mexico which grew by 20.1% to RM2.11 billion, fuelled by higher exports of E&E products.
Meanwhile, exports to the ROK increased by 16.3% to RM4.44 billion propelled by robust exports of optical and scientific equipment, exports to India recorded growth of 8.5% to RM4.37 billion boosted by higher exports of crude petroleum and exports to the UK surged by 22.7% to RM795.4 million owing to strong demand for chemicals and chemical products.
Compared to January 2026, trade, exports and imports slipped by 13.0%, 17.2% and 8.2%, respectively.
Trade with FTA partners during the first two months of 2026 increased by 10.0% to RM333.86 billion compared to the corresponding period in 2025. Exports were up by 7.1% to RM173.99 billion while imports rose 13.5% to RM159.86 billion.
Import Performance
Total imports in February 2026 rose 8.2% y-o-y to RM114.24 billion. The three main categories of imports by end use, which accounted for 73.8% of total imports were:
- Intermediate goods, valued at RM59.15 billion or 51.8% of total imports, increased by 0.8%, due to higher imports of parts and accessories of non transport capital goods;
- Capital goods, valued at RM15.94 billion or 14.0% of total imports, rose 15.4%, as a result of growing imports of non-transport capital goods; and
- Consumption goods, valued at RM9.20 billion or 8.1% of total imports, expanded by 1.5%, driven by higher imports of durables.
Compared to January 2026, imports slipped by 8.5% as imports of intermediate and capital goods grew by 2.5% and 1.3%, respectively while imports of consumption goods shrank 18.3%.
During the period of January to February 2026, imports expanded by 6.4% to RM239.11 billion compared to the same period last year. Imports of consumption goods were up by 7.0% to RM20.46 billion, while intermediate goods fell 2.2% to RM116.84 billion and capital goods declined by 6.1% to RM31.68 billion.