Malaysia’s January-August Trade Grows 3.8% y-o-y as Exports Surpass RM1-trillion Mark a Month Earlier
Exports Maintain Growth in August, Despite Lower US-Bound Shipments
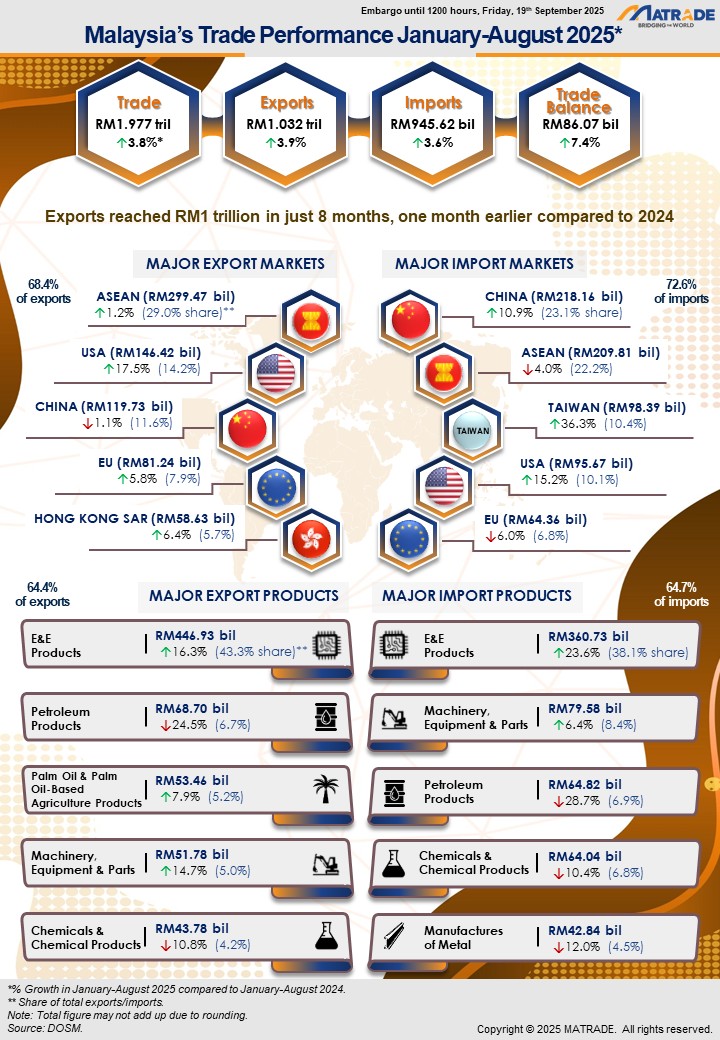
Malaysia recorded its highest cumulative values for trade for trade, exports and imports for the period January-August 2025. Trade rose by 3.8% year-on-year (y-o-y) to RM1.977 trillion. Exports increased by 3.9% to RM1.032 trillion, surpassing the RM1 trillion mark a month earlier than in 2024. Meanwhile, imports grew by 3.6% to RM945.62 billion, resulting in a trade surplus of RM86.07 billion.
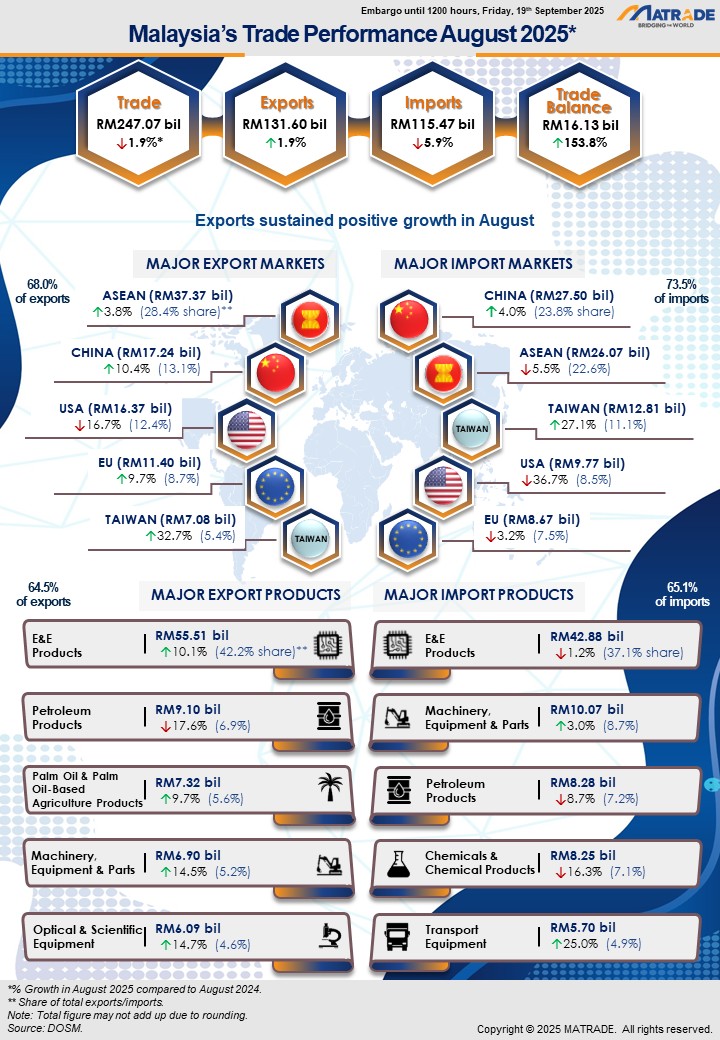
For just the month of August 2025, however, trade eased slightly by 1.9% y-o-y to RM247.07 billion amid shifting global trade conditions, although exports grew for the second consecutive month by 1.9% to RM131.6 billion. Imports, on the other hand, declined by 5.9% to RM115.47 billion. This resulted in a trade surplus of RM16.13 billion, marking the 64th consecutive month of trade surplus since May 2020, an increase of 153.8% compared to August 2024.
Export growth in August 2025 was driven by strong performances in both manufactured and agriculture goods. Exports of agriculture goods recovered from negative growth recorded in July 2025. The expansion of trade numbers was mainly contributed by electrical and electronic (E&E) products, followed by machinery, equipment and parts, optical and scientific equipment as well as palm oil and palm oil-based agriculture products. Notably, exports of optical and scientific equipment recorded their highest value to date.
While Malaysia’s overall trade performance remained resilient from January to August 2025, exporters are strongly encouraged to improve and diversify their product offerings, as well as strengthen supply chain efficiencies to mitigate the transitional effects of shifts in trade policies and uncertainties in the global trading landscape. Exporters are also encouraged to utilize the 18 Free Trade Agreements that have been ratified by Malaysia with various countries and economies.
Export Performance of Major Sectors
Exports of Agriculture Goods Rebounded
In August 2025, exports of manufactured goods which absorbed 86.5% of total exports expanded by 1.7% y-o-y to RM113.86 billion as a result of higher exports of E&E products, machinery, equipment and parts, optical and scientific equipment as well as palm oil-based manufactured products. Exports of optical and scientific equipment recorded their highest value to date.
Exports of agriculture goods (7.3% share) in August 2025 rebounded by 4.5% y-o-y to RM9.54 billion owing to improved exports of palm oil and palm oil-based agriculture products due to higher export prices.
Exports of mining goods (5.4% share) in August 2025 slipped by 2.4% y-o-y to RM7.11 billion. The drop was mainly due to lower export volumes and prices of crude petroleum as well as decreased export prices of liquified natural gas (LNG). Conversely, higher shipments were recorded for metalliferous ores and metal scrap.
Major exports in August 2025:
- E&E products, valued at RM55.51 billion and accounted for 42.2% of total exports, increased by 10.1% compared to August 2024;
- Petroleum products, RM9.1 billion, 6.9% of total exports, ↓17.6%; • Palm oil and palm oil-based agriculture products, RM7.32 billion, 5.6% of total exports, ↑9.7%;
- Machinery, equipment and parts, RM6.9 billion, 5.2% of total exports, ↑14.5%; and
- Optical and scientific equipment, RM6.09 billion, 4.6% of total exports, ↑14.7%.
On a month-on-month (m-o-m) basis, exports of agriculture goods increased by 5.2%, meanwhile exports of manufactured and mining goods contracted by 6.6% and 11.6%, respectively.
During the first eight months of 2025, exports of manufactured goods rose 5.2% to RM892.27 billion compared to the same period in 2024 backed by robust exports of E&E products, machinery, equipment and parts as well as palm oil-based manufactured products. Exports of agriculture goods rose 7.2% to RM71.81 billion owing to increased exports of palm oil and palm oil-based agriculture products. However, exports of mining goods dropped 16.6% to RM59.22 billion on account of lower exports of LNG and crude petroleum.
Trade Performance with Major Markets
In August 2025, Malaysia’s trade with major trading partners namely ASEAN, China, the United States (US), the European Union (EU) and Taiwan accounted for 70.5% share of total trade.
ASEAN – Sustained Export Growth
In August 2025, trade with ASEAN which comprised 25.7% of Malaysia’s total trade edged down by 0.2% y-o-y to RM63.44 billion. Exports continued to grow for the second consecutive month, rising 3.8% to RM37.37 billion backed by increased shipments of E&E products. Imports from ASEAN were down by 5.5% to RM26.07 billion.
Breakdown of exports to ASEAN countries:
- Singapore RM19.38 billion, increased by 2.7%, y-o-y;
- Thailand RM5.47 billion, ↑20.7%;
- Viet Nam RM5.04 billion, ↑31.3%;
- Indonesia RM4.24 billion, ↓23.2%;
- Philippines RM2.06 billion, ↓16.4%;
- Brunei RM515.5 million, ↑15.8%;
- Cambodia RM428.2 million, ↑140.3%;
- Myanmar RM227.1 million, ↑53.6%; and
- Lao PDR RM7.2 million, ↑71.2%.
Major markets in ASEAN that recorded export growth were Singapore which expanded by RM509.8 million y-o-y, Thailand which increased by RM940.2 million and Viet Nam which grew by RM1.2 billion, following higher exports of E&E products.
Compared to July 2025, trade, exports and imports declined by 12.3%, 14% and 9.6%, respectively.
For the period of January to August 2025, trade with ASEAN contracted by 1% to RM509.29 billion compared to the same period in 2024. Exports grew by 1.2% to RM299.47 billion underpinned by higher shipments of E&E products as well as machinery, equipment and parts. Imports from ASEAN slipped by 4% to RM209.81 billion.
China – Exports Grew for the Second Consecutive Month
Trade with China in August 2025 which made up 18.1% of Malaysia’s total trade, rose 6.4% y-o-y to RM44.74 billion. Exports maintained its growth momentum for the second consecutive month, recording a double-digit increase of 10.4% to RM17.24 billion attributed to higher demand for E&E products, metalliferous ores and metal scrap, LNG as well as palm oil-based manufactured products. Imports from China grew by 4% to RM27.5 billion.
Compared to July 2025, trade and exports expanded by 0.9% and 9.8%, respectively while imports declined by 4%.
During the first eight months of 2025, trade with China rose 6.3% to RM337.89 billion compared to the corresponding period in 2024. Exports contracted by 1.1% to RM119.73 billion, waned by lower exports of LNG, manufactures of metal, chemicals and chemical products as well as paper and pulp products. Nevertheless, the contraction was cushioned by higher exports of E&E products, machinery, equipment and parts as well as palm oil-based manufactured products. Imports from China increased by 10.9% to RM218.16 billion.
The US – Trade, Exports and Imports Retained Growth in the First Eight Months of 2025
In August 2025, trade with the US which constituted 10.6% of Malaysia’s total trade reduced by 25.5% y-o-y to RM26.14 billion. Exports contracted by 16.7% to RM16.37
billion, weighed down by lower shipments of E&E products, despite growth in exports of machinery, equipment and parts as well as optical and scientific equipment. Imports from the US slipped by 36.7% to RM9.77 billion. The overall decline in trade with the US may reflect the early impact of recent tariff adjustments introduced by the US government effective 7th August 2025, which have likely affected demand and trade flows in key sectors.
On a m-o-m basis, trade, exports and imports dropped 10.9%, 11.4% and 10.1%, respectively.
For the period of January to August 2025, trade with the US continued to expand, recording a 16.6% expansion to RM242.09 billion. Exports increased by 17.5% to RM146.42 billion, contributed by strong exports of E&E products, processed food as well as machinery, equipment and parts. Imports from the US rose 15.2% to RM95.67 billion.
The EU – Trade Rebounded
In August 2025, trade with the EU which took up 8.1% of Malaysia’s total trade improved by 3.7% y-o-y to RM20.07 billion. Exports grew by 9.7% to RM11.4 billion, the seventh successive month of expansion, propelled by robust demand for E&E products, iron and steel products as well as palm oil and palm oil-based agriculture products. Imports from the EU shrank 3.2% to RM8.67 billion.
Within the EU, the top 10 markets which accounted for 92.6% of Malaysia’s total exports to the region were:
- Netherlands RM3.60 billion, increased by 25.5%, y-o-y;
- Germany RM2.96 billion, ↑0.4%;
- Italy RM756.3 million, ↑60.6%;
- Spain RM706.5 million, ↓12.5%;
- Czech Republic RM594.9 million, ↑132.9%;
- Belgium RM532.1 million, ↓29.9%;
- France RM428.9 million, ↓28.8%;
- Hungary RM367.2 million, ↑2.3%;
- Austria RM353.9 million, ↑258.9%; and
- Poland RM257.8 million, ↓14.3%.
Exports to the Netherlands increased by RM731.9 million y-o-y attributed to higher exports of E&E products, exports to Germany grew by RM11.4 million following higher exports of processed food and exports to Italy were up by RM285.3 million, due to increased exports of palm oil and palm oil-based agriculture products.
Compared to July 2025, trade, exports and imports increased by 3.5%, 4.9% and 1.7%, respectively.
For the period of January to August 2025, trade with the EU edged up by 0.2% to RM145.6 billion compared to the same period last year. Exports increased by 5.8% to RM81.24 billion supported by robust exports of E&E products as well as palm oil-based manufactured products. Imports from the EU waned by 6% to RM64.36 billion.
Taiwan – Trade, Exports and Imports Posted Double-Digit Expansion
In August 2025, trade with Taiwan which represented 8.1% of Malaysia’s total trade posted double-digit expansion of 29% y-o-y to RM19.89 billion. Exports surged by 32.7% to RM7.08 billion, fuelled by solid exports of E&E products as well as machinery, equipment and parts. Imports from Taiwan climbed 27.1% to RM12.81 billion.
On a m-o-m basis, trade, exports and imports decreased by 13.7%, 9.5% and 15.9%, respectively.
In January to August 2025, trade with Taiwan recorded a robust growth of 34.2% compared to the same period last year, reaching RM152.57 billion. Exports soared by 30.5% to RM54.19 billion, spurred by higher shipments of E&E products, optical and scientific equipment as well as machinery, equipment and parts. Imports from Taiwan were up by 36.3% to RM98.39 billion.
Trade with FTA Partners
In August 2025, trade with FTA partners which contributed 65.1% to Malaysia’s total trade expanded by 1.4% y-o-y to RM160.74 billion. Exports to FTA partners increased by 4.6% to RM88.32 billion while imports shrank 2.3% to RM72.42 billion. Increases in exports were recorded to Mexico, which surged by 113.7% to RM3.11 billion and to Australia which edged up by 1.6% to RM4.82 billion, both buoyed by higher exports of E&E products.
Additionally, exports to the ROK rose 5.5% to RM4.73 billion supported by increased exports of LNG and exports to India expanded by 12.7% to RM4.52 billion following higher exports of palm oil and palm oil-based agriculture products. Meanwhile, exports to Pakistan soared by 66% to RM720.9 million on robust exports of chemicals and chemical products.
Compared to July 2025, trade, exports and imports reduced by 6.4%, 5.5% and 7.5%, respectively.
Trade with FTA partners during the first eight months of 2025 increased by 0.7% to RM1.265 trillion compared to the same period in 2024. Exports edged up by 0.2% to RM680.42 billion and imports rose 1.3% to RM584.29 billion.
Import Performance
Total imports in August 2025 decreased by 5.9% y-o-y to RM115.47 billion. The three main categories of imports by end use, which accounted for 73.9% of total imports were:
- Intermediate goods, valued at RM60.25 billion or 52.2% of total imports, declined by 16.8%, due to lower imports of parts and accessories of non transport capital goods;
- Capital goods, valued at RM15.72 billion or 13.6% of total imports, increased by 11%, as a result of higher imports of industrial transport equipment; and
- Consumption goods, valued at RM9.41 billion or 8.2% of total imports, contracted by 8.9%, due to lower imports of processed food and beverages mainly for household consumption.
Compared to July 2025, total imports reduced by 8% with imports of intermediate goods expanded by 6%, while imports of capital and consumption goods decreased by 13.4% and 9.8%, respectively.
During the period of January to August 2025, total imports grew by 3.6% to RM945.62 billion compared to the same period last year. Imports of intermediate goods fell 4.9% to RM479.1 billion, capital goods rose 33% to RM141.28 billion and consumption goods edged down by 0.9% to RM77.91 billion.