Trade Statistics
Top 10 Major Export Countries, 2020
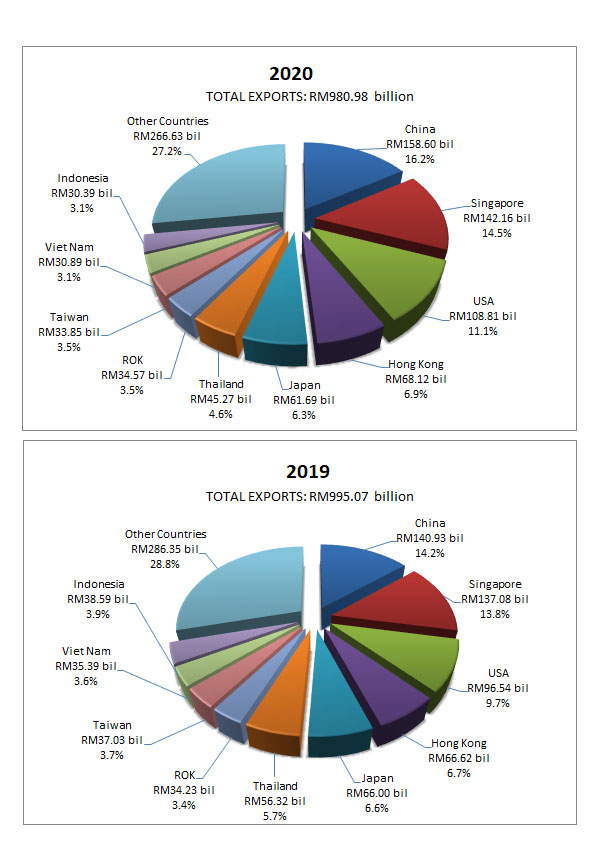
Source: Department of Statistics, Malaysia
Tabulated by: MATRADE
Notes:
2019 - final data
2020 - provisional data
Top 10 Major Import Products, 2020

Source: Department of Statistics, Malaysia
Tabulated by: MATRADE
Notes:
2019 - final data
2020 - provisional data
Malaysia's Exports by Main Sectors, 2020
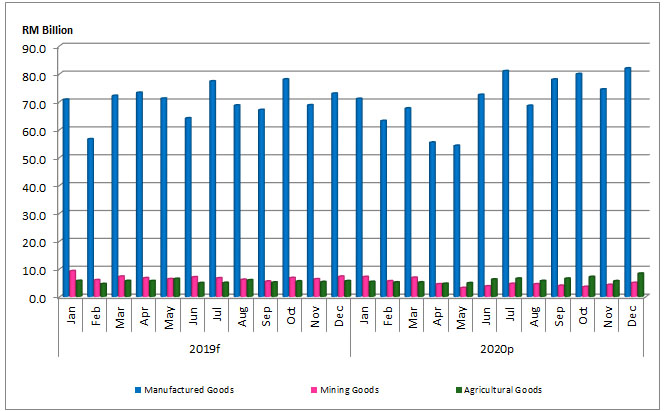
Source: Department of Statistics, MalaysiaTabulated by: MATRADE
Notes:
p - provisional data
f - final data
Top 10 Major Export Products, 2020
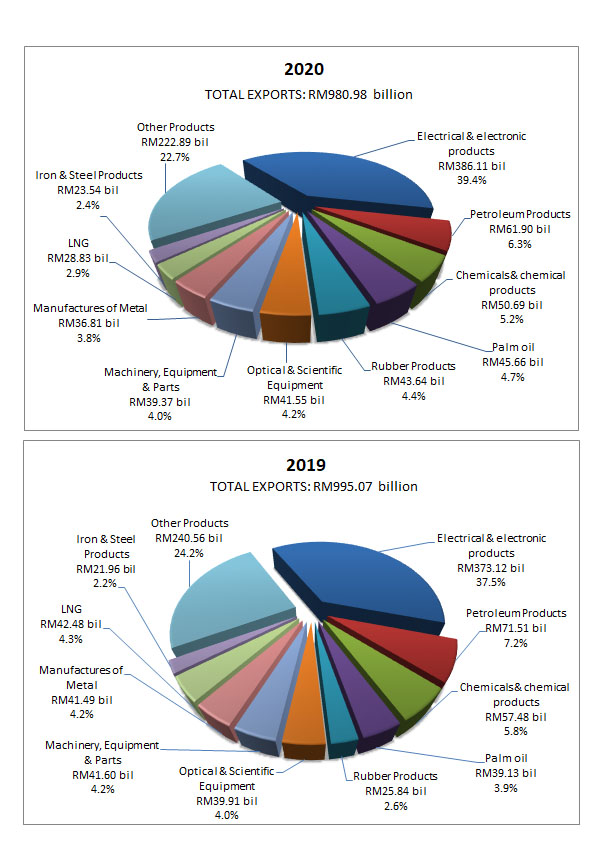
Source: Department of Statistics, Malaysia
Tabulated by: MATRADE
Notes:
2019 - final data
2020 - provisional data
Summary of Malaysia's Monthly Trade 2020
| Month | Total Exports (RM Billion) | Total Imports (RM Billion) | Total Trade (RM Billion) | Balance of Trade (RM Billion) |
|---|---|---|---|---|
| January | 84.11 | 72.08 | 156.20 | 12.03 |
| February | 74.45 | 61.83 | 136.28 | 12.62 |
| March | 80.12 | 67.80 | 147.92 | 12.31 |
| April | 64.79 | 68.42 | 133.21 | -3.63 |
| May | 62.65 | 52.26 | 114.91 | 10.39 |
| June | 82.82 | 61.97 | 144.79 | 20.85 |
| July | 92.56 | 67.38 | 159.94 | 25.18 |
| August | 79.13 | 65.91 | 145.04 | 13.22 |
| September | 88.91 | 66.96 | 155.86 | 21.95 |
| October | 91.05 | 68.93 | 159.98 | 22.12 |
| November | 84.66 | 67.61 | 152.27 | 17.05 |
| December | 95.73 | 75.04 | 170.77 | 20.69 |
Source: Department of Statistics, Malaysia
Tabulated by: MATRADE
Notes:
2019 - final data
2020 - provisional data
Any discrepancies in the data presented are due to rounding errors.