


 9 / 218

INDUSTRY OVERVIEW
Malaysian ICT Industry Outlook
Information and Communications Technology (ICT) has become an important sector in
Malaysia’s economic development since the Government acknowledged its importance
as one of the strategies in creating an industrial-based economy and a knowledge-based
economy. Hence, from the role as manufacturer & exporter of ICT products, Malaysia
moves higher in the industry value chain as provider & exporter of ICT services.
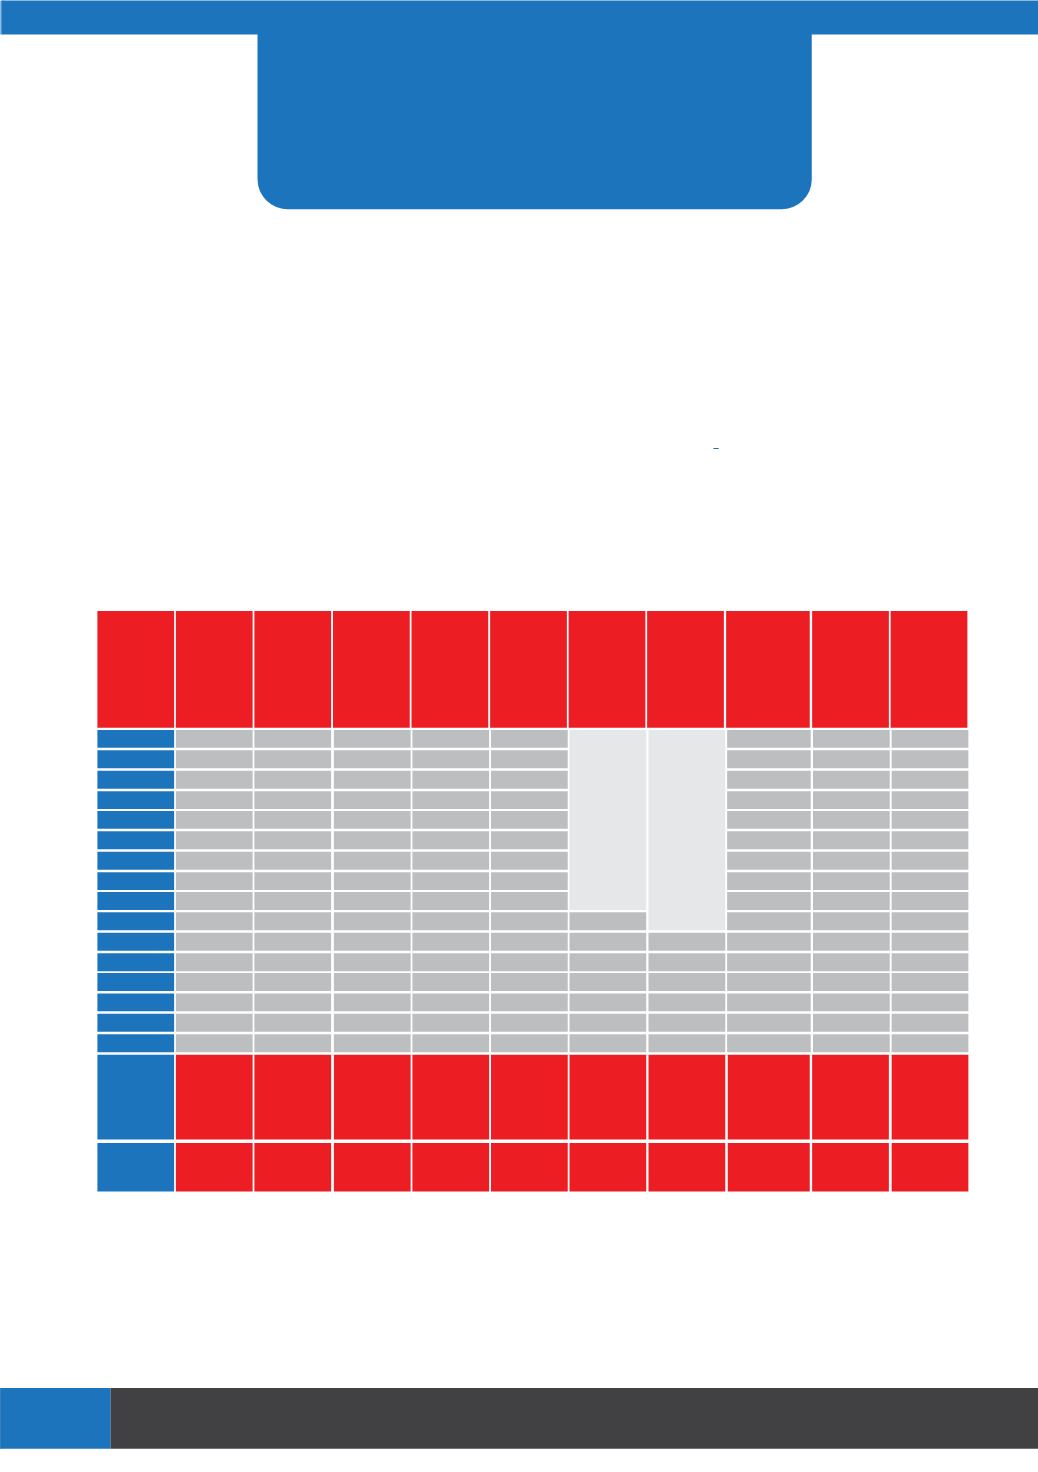
The ICT services components entailing telecommunication, data communication,
computer, publishing, broadcasting and information services activities have been
continuously registering positive outlook (Refer to Figure 1). Pertinently, the share of ICT
Services to Gross Domestic Product (GDP) in 2000 was only 3.3%. By 2015, the share of ICTS
has been projected to touch 7.0% of GDP.
A decade ago exports and imports of Malaysian services, in particular ICTs was unheard of.
With the initiation of MSC Malaysia programme in the mid-nineties, besides domestic
demand the trade in ICTS has been shoring up the overall growth of services sector. In this
vi
Year
ICTS Value
Added
Services
(’000)
100.0
55.7
76.8
4.2
2.1
6.0
10.9
23.2
21.1
13.0
9.8
10.4
25.4
24.4
26.1
33.4
28.6
11.9
Share of
ICTS to
Overall
GDP (%)
Telecommu-
nication
Services
(’000)
Computer
Services
(’000)
Sub-total
(’000)
Publishing
(’000)
Motion
picture,
video and
television
programme
(’000)
Programming
&
Broadcasting
(’000)
Information
Services
(’000)
Sub-total
(’000)
2000
2001
2002
2003
2004
2005
2006
2007
2008
2009
2010
2011
2012
2013
2014
2015
Projected
Sub- Sector
Share (%)
in 2015
CAGR (%) :
2010 - 2015
11,771,057
12,744,792
14,652,306
14,992,154
16,087,422
20,187,921
23,858,012
25,036,393
30,090,354
31,999,469
42,095,951
45,259,877
52,430,520
59,835,527
67,991,747
77,695,421
3.3
3.6
3.8
3.6
3.4
3.9
4.2
3.9
3.9
4.5
5.3
5.1
5.6
6.1
6.4
7.0
10,335,256
10,815,979
12,261,462
12,368,517
12,773,701
16,352,349
19,252,783
19,532,436
22,655,972
22,912,378
27,106,855
29,778,845
33,166,728
36,386,010
39,810,610
43,295,865
868,758
1,257,657
1,412,888
1,916,304
2,056,348
2,718,059
3,125,191
3,772,887
5,168,116
6,496,356
9,363,020
9,945,621
11,862,431
12,774,925
13,687,420
16,397,063
11,204,014
12,073,636
13,674,350
14,284,821
14,830,049
19,070,408
22,377,974
23,305,323
27,824,088
29,408,734
36,469,875
39,724,466
45,029,159
49,160,935
53,498,030
59,692,928
271,688
503,080
590,079
719,835
1,038,179
1,409,616
1,604,272
1,056,006
1,065,823
1,405,592
2,027,211
2,752,501
3,276,554
193,273
269,319
254,765
255,963
356,714
387,730
419,412
427,088
447,618
1,483,674
1,565,327
1,690,288
2,150,865
3,102,079
4,211,933
4,659,988
373,770
401,837
723,191
451,370
900,659
729,783
1,060,626
1,303,982
1,818,648
1,839,604
2,001,388
2,189,221
3,125,069
4,507,122
6,119,667
8,461,679
567,043
671,156
977,956
707,333
1,257,373
1,117,513
1,480,038
1,731,070
2,266,266
3,594,966
5,125,801
5,535,411
7,401,361
10,674,592
14,493,717
18,002,493
Source: Department of Statistics and PIKOM Estimates
Figure 1: Distribution and Growth Rates of ICT Services by Sub-sectors: 2000-2015